Pynsee python package contains tools to easily search and download French data from INSEE and IGN APIs


pynsee gives a quick access to more than 150 000 macroeconomic series,
a dozen datasets of local data, numerous sources available on insee.fr
as well as key metadata and SIRENE database containing data on all French companies.
Have a look at the detailed API page portail-api.insee.fr.
This package is a contribution to reproducible research and public data transparency. It benefits from the developments made by teams working on APIs at INSEE and IGN.
Installation & API subscription
Credentials are necessary to access SIRENE API available through pynsee by the sirene module. API credentials can be created here: portail-api.insee.fr. All other modules are freely accessible.
# Get the development version from GitHub
# git clone https://github.com/InseeFrLab/pynsee.git
# cd pynsee
# pip install .[full]

# Subscribe to portail-api.insee.fr and get your credentials!
# Save your credentials with init_conn function :
from pynsee.utils import init_conn
init_conn(sirene_key="my_sirene_key")

# Beware : any change to the keys should be tested after having cleared the cache
# Please do : from pynsee.utils import clear_all_cache; clear_all_cache()
```

##  Data Search and Collection Advice
Data Search and Collection Advice
- Macroeconomic data :
First, use
get_dataset_list()to search what are your datasets of interest and then get the series list withget_series_list(). Alternatively, you can make a keyword-based search withsearch_macrodata(), e.g.search_macrodata('GDP'). Then, get the data withget_dataset()orget_series()
Local data : use first
get_local_metadata(), then get data withget_local_data()Metadata : e.g. function to get the classification of economic activities (Naf/Nace Rev2)
get_activity_list()Sirene (French companies database) : use first
get_dimension_list(), then usesearch_sirene()with dimensions as filtering variablesGeodata : get the list of available geographical data with
get_geodata_list()and then retrieve it withget_geodata()Files on insee.fr: get the list of available files on insee.fr with
get_file_list()and then download it withdownload_file()
There is also the list of all modules and functions in Modules and functions, and more information about Configuration and utilities.
For further advice, have a look at the documentation and gallery of the examples.
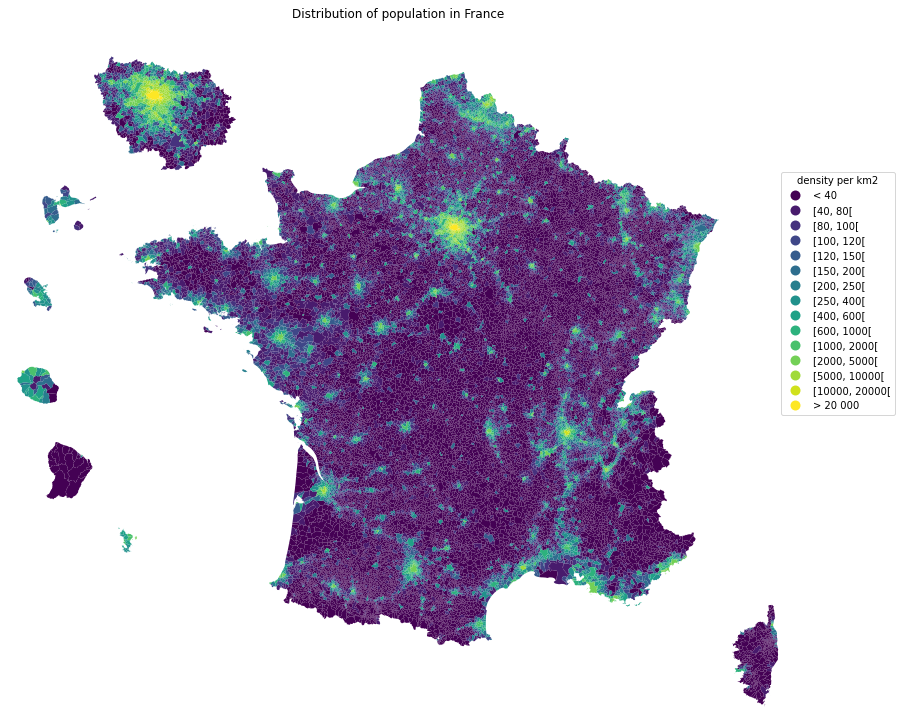
Example - Population Map
import matplotlib.pyplot as plt
import numpy as np
import pandas as pd

from pynsee.geodata import get_geodata_list, get_geodata


# get geographical data list
geodata_list = get_geodata_list()
# get departments geographical limits
mapcom = get_geodata("ADMINEXPRESS-COG-CARTO.LATEST:commune").to_crs(epsg=3035)

# area calculations depend on crs which fits metropolitan france but not overseas departements
# figures should not be considered as official statistics
mapcom.attrs["area"] = mapcom.area / 10**6
mapcom = mapcom.to_crs(epsg=3857)

mapcom['REF_AREA'] = 'D' + mapcom['code_insee']
mapcom['density'] = mapcom['population'] / mapcom.attrs["area"]

mapcom = mapcom.transform_overseas(departement=['971', '972', '974', '973', '976', 'NR'],
                          factor=[1.5, 1.5, 1.5, 0.35, 1.5, 1.5])

mapcom = mapcom.zoom(
    departement=["75","92", "93", "91", "77", "78", "95", "94"],
    factor=1.5, startAngle = math.pi * (1 - 3.5 * 1/9))

density_ranges = [
    40, 80, 100, 120, 150, 200, 250, 400, 600, 1000, 2000, 5000, 10000, 20000
]

rvals = np.full(len(mapcom), "< 40", dtype=object)

list_ranges = ["< 40"]

for rmin, rmax in zip(density_ranges, density_ranges[1:]):
    range_string = f"[{rmin}, {rmax}["
    list_ranges.append(range_string)

    rvals[(mapcom.density >= rmin) & (mapcom.density < rmax)] = range_string

rvals[mapcom.density.values > density_ranges[-1]] = "> 20 000"

list_ranges.append("> 20 000")

mapcom.loc[:, "range"] = pd.Categorical(rvals, ordered=True, categories=list_ranges)

fig, ax = plt.subplots(1, 1, figsize=(15, 15))
lgd = {'bbox_to_anchor': (1.1, 0.8), 'title': 'density per km2'}
mapcom.plot(column="range", cmap=cm.viridis, legend=True, ax=ax, legend_kwds=lgd)
ax.set_axis_off()
ax.set(title='Distribution of population in France')
plt.show()

fig.savefig('pop_france.svg',
            format='svg', dpi=1200,
            bbox_inches = 'tight',
            pad_inches = 0)
```

## How to avoid proxy issues ?
How to avoid proxy issues ?
          http_proxy="http://my_proxy_server:port",
          https_proxy="http://my_proxy_server:port")

# Beware : any change to the keys should be tested after having cleared the cache
# Please do : from pynsee.utils import *; clear_all_cache()

# Alternativety you can use directly environment variables as follows.
# Beware not to commit your credentials!
import os
os.environ['sirene_key'] = 'my_sirene_key'
os.environ['http_proxy'] = "http://my_proxy_server:port"
os.environ['https_proxy'] = "http://my_proxy_server:port"

```
Support
Feel free to open an issue with any question about this package using <https://github.com/InseeFrLab/pynsee/issues> Github repository.
Contributing
All contributions, whatever their forms, are welcome. See CONTRIBUTING.md