Automotive industry sites
[1]:
import pandas as pd
import numpy as np
from shapely.ops import transform

#%matplotlib inline
import matplotlib.pyplot as plt
import matplotlib.cm as cm
from matplotlib.offsetbox import AnchoredText

from pynsee import *
/opt/python/lib/python3.13/site-packages/tqdm/auto.py:21: TqdmWarning: IProgress not found. Please update jupyter and ipywidgets. See https://ipywidgets.readthedocs.io/en/stable/user_install.html
  from .autonotebook import tqdm as notebook_tqdm
[2]:
# get activity list
naf5 = get_activity_list('NAF5')

# search data in SIRENE database
data = search_sirene(variable="activitePrincipaleEtablissement",
                     pattern='29.10Z', kind='siret', number=2000)
[3]:
data.to_csv('sirene.csv')
[4]:
data.head()
[4]:
| siren | nic | siret | dateDebut | dateCreationEtablissement | dateCreationUniteLegale | dateFin | denominationUniteLegale | nomUniteLegale | prenomUsuelUniteLegale | ... | libelleVoie2Etablissement | codePostal2Etablissement | libelleCommune2Etablissement | libelleCommuneEtranger2Etablissement | distributionSpeciale2Etablissement | codeCommune2Etablissement | codeCedex2Etablissement | libelleCedex2Etablissement | codePaysEtranger2Etablissement | libellePaysEtranger2Etablissement | |
|---|---|---|---|---|---|---|---|---|---|---|---|---|---|---|---|---|---|---|---|---|---|
| 0 | 006580195 | 00011 | 00658019500011 | 2008-01-01 | 1965-01-01 | 1965-01-01 | None | SOCIETE INDUSTRIELLE POUR LE DEVELOPPEMENT DE ... | None | None | ... | None | None | None | None | None | None | None | None | None | None |
| 1 | 085520195 | 00109 | 08552019500109 | 2022-09-01 | 2022-06-30 | 1955-01-01 | None | SAFRA | None | None | ... | None | None | None | None | None | None | None | None | None | None |
| 2 | 301692307 | 00020 | 30169230700020 | 2020-12-31 | 2014-08-15 | 1965-01-01 | None | GARAGE BEYRIS | None | None | ... | None | None | None | None | None | None | None | None | None | None |
| 3 | 302279229 | 00025 | 30227922900025 | 2014-07-25 | 1900-01-01 | 1975-01-01 | None | RAPIDO | None | None | ... | None | None | None | None | None | None | None | None | None | None |
| 4 | 302279229 | 00033 | 30227922900033 | 2008-01-01 | 1996-01-01 | 1975-01-01 | None | RAPIDO | None | None | ... | None | None | None | None | None | None | None | None | None | None |
5 rows × 96 columns
[5]:
# keep only businesses with more then 100 employees
df = data.loc[data['effectifsMinEtablissement'] > 100]
df = df.reset_index(drop=True)
# find latitude and longitude of all businesses
gdf = df.get_location().sort_values(by=['effectifsMinEtablissement'], ascending=False)
Existing environment variable sirene_key used, instead of locally saved credentials
Getting location: 100%|██████████| 49/49 [00:00<00:00, 16367.04it/s]
Getting location: 100%|██████████| 8/8 [00:00<00:00, 7339.11it/s]
[6]:
# get map - departement limits
geodataList =  get_geodata_list()
mapdep = get_geodata('ADMINEXPRESS-COG-CARTO.LATEST:departement', update=True)
mapdep = mapdep.transform_overseas()
mapdep.head()
NR is missing from code_insee_du_departement column !
[6]:
| geometry | cleabs | nom_officiel | nom_officiel_en_majuscules | code_insee | code_insee_de_la_region | code_siren | code_insee_du_departement | |
|---|---|---|---|---|---|---|---|---|
| 0 | MULTIPOLYGON (((277926.054 5709617.925, 277848... | DEPARTEM0000000000000063 | Puy-de-Dôme | PUY-DE-DOME | 63 | 84 | 226300010 | 63 |
| 1 | MULTIPOLYGON (((336295.261 6472777.256, 336428... | DEPARTEM0000000000000059 | Nord | NORD | 59 | 32 | 225900018 | 59 |
| 2 | MULTIPOLYGON (((-91403.654 6186431.719, -91543... | DEPARTEM0000000000000061 | Orne | ORNE | 61 | 28 | 226100014 | 61 |
| 3 | MULTIPOLYGON (((582085.39 5342294.655, 582092.... | DEPARTEM0000000000000013 | Bouches-du-Rhône | BOUCHES-DU-RHONE | 13 | 93 | 221300015 | 13 |
| 4 | MULTIPOLYGON (((259950.061 6258104.764, 260905... | DEPARTEM0000000000000075 | Paris | PARIS | 75 | 11 | 227500055 | 75 |
[7]:
# make cleaned labels
match_list = ['RENAULT SAS', 'ALPINE', 'BATILLY', 'MAUBEUGE CONSTRUCTION',
              'TOYOTA', 'STELLANTIS AUTO SAS', 'RENAULT TRUCKS']
other_string_list = '|'.join(['[^' + x + ']' for x in match_list])

conditions = [gdf['denominationUniteLegale'].str.contains(x) for x in match_list]
conditions += [gdf['denominationUniteLegale'].str.contains(other_string_list)]

values = ['RENAULT SAS', 'RENAULT SAS', 'RENAULT SAS', 'RENAULT SAS',
          'TOYOTA', 'STELLANTIS AUTO SAS', 'RENAULT TRUCKS', 'OTHER']

gdf['label'] = np.select(conditions, values, default="OTHER")
[8]:
# change projection
gdf = gdf.to_crs('EPSG:3857')
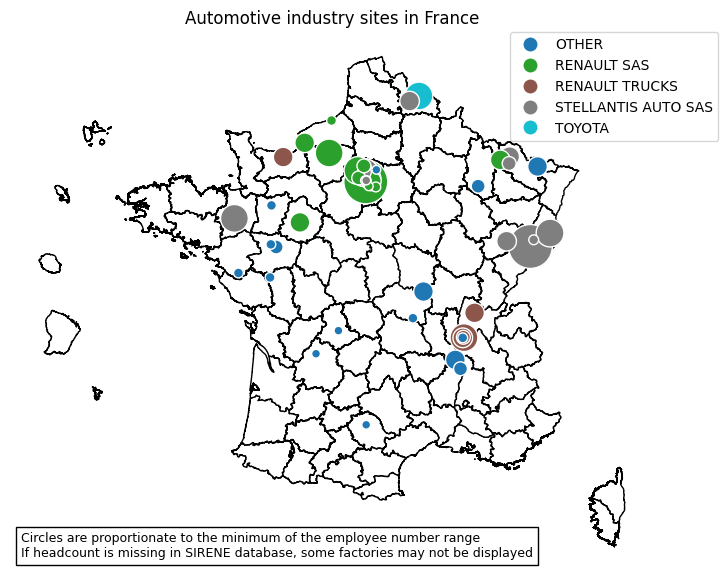
# annotation
txt = 'Circles are proportionate to the minimum of the employee number range'
txt += '\nIf headcount is missing in SIRENE database, some factories may not be displayed'
#plot
ax = mapdep.plot(color='white', edgecolor='black', figsize = (15,7))
plt.title('Automotive industry sites in France')
gdf.plot(ax=ax,
column = 'label',
edgecolor='white',
markersize=gdf.effectifsMinEtablissement/5,
legend=True,
legend_kwds={'bbox_to_anchor': (1.1,1),
'loc':1, 'borderaxespad': 0})
at = AnchoredText(txt, prop=dict(size=9), frameon=True, loc='lower left')
ax.add_artist(at)
ax.set_axis_off()
plt.show()