Commuting to work in the Paris region
[1]:
from pynsee import *
import copy
import pandas as pd
import numpy as np
import seaborn as sns
from shapely.geometry import Point
from pyvis.network import Network
from IPython.display import Markdown, display

files = get_file_list()
files_rp = (files
            .query("collection == 'RP'")
            .query("id.str.contains('RP_MOBP|RP_POP')")
            [['id', 'label']])

files_rp.to_csv('rp.csv')
files_rp
[1]:
| id | label | |
|---|---|---|
| 1309 | RP_MOBPRO_2015 | Données du Recensement de Population, table de... |
| 1318 | RP_MOBPRO_2016 | Données du Recensement de Population, table de... |
| 1327 | RP_MOBPRO_2017 | Données du Recensement de Population, table de... |
| 1337 | RP_MOBPRO_2018 | Données du Recensement de Population, table de... |
| 1346 | RP_MOBPRO_2019 | Données du Recensement de Population, table de... |
| 1355 | RP_MOBPRO_2020 | Données du Recensement de Population, table de... |
| 1365 | RP_POP_LEGALE_COM | Populations légales des communes en vigueur au... |
[2]:
geodata_files = get_geodata_list()
geodata_files.to_csv('geodata_files.csv')
[3]:
# download metadata
col = get_column_metadata('RP_MOBPRO_2020')
col.to_csv('rp_col.csv')

col2 = col[['column', 'column_label_fr']].drop_duplicates()
Metadata for RP_MOBPRO_2020 has not been found, metadata for RP_MOBPRO_2016 is provided instead
[4]:
# data on means of transport
display(col.query("column == 'TRANS'"))

dclt = (col
    .query("column == 'DCLT'")
    ['column_label_fr']
    .to_list())

print(f"{dclt=}")
| column | value | value_label_fr | column_label_fr | |
|---|---|---|---|---|
| 182 | TRANS | 1 | Pas de transport | Mode de transport principal le plus souvent ut... |
| 183 | TRANS | 2 | Marche à pied | Mode de transport principal le plus souvent ut... |
| 184 | TRANS | 3 | Deux roues | Mode de transport principal le plus souvent ut... |
| 185 | TRANS | 4 | Voiture, camion, fourgonnette | Mode de transport principal le plus souvent ut... |
| 186 | TRANS | 5 | Transports en commun | Mode de transport principal le plus souvent ut... |
| 187 | TRANS | Z | Sans objet | Mode de transport principal le plus souvent ut... |
dclt=['Département, commune et arrondissement municipal (Paris,Lyon,Marseille) du lieu de travail']
[5]:
# download data about workers commuting from home to work place
RP_MOBPRO_2020 = download_file('RP_MOBPRO_2020')
RP_MOBPRO_2020.head(3)
Extracting: 100%|██████████| 823M/823M [00:04<00:00, 173MB/s]
[5]:
| COMMUNE | ARM | DCFLT | DCLT | AGEREVQ | CS1 | DEROU | DIPL | EMPL | ILT | ... | REGION | REGLT | SEXE | STAT | STOCD | TP | TRANS | TYPL | TYPMR | VOIT | |
|---|---|---|---|---|---|---|---|---|---|---|---|---|---|---|---|---|---|---|---|---|---|
| 0 | 01001 | ZZZZZ | 99999 | 01001 | 040 | 2 | Z | 16 | 21 | 1 | ... | 84 | 84 | 2 | 21 | 21 | 1 | 1 | 1 | 41 | 2 |
| 1 | 01001 | ZZZZZ | 99999 | 01001 | 045 | 5 | Z | 14 | 16 | 1 | ... | 84 | 84 | 2 | 10 | 22 | 2 | 5 | 2 | 12 | 1 |
| 2 | 01001 | ZZZZZ | 99999 | 01001 | 020 | 2 | Z | 14 | 21 | 1 | ... | 84 | 84 | 2 | 21 | 10 | 1 | 1 | 1 | 41 | 3 |
3 rows × 32 columns
[6]:
# download geographical data on commune and arrondissement
com = get_geodata('ADMINEXPRESS-COG-CARTO.LATEST:commune')
arr = get_geodata('ADMINEXPRESS-COG-CARTO.LATEST:arrondissement_municipal')
[7]:
# define communes metadata and colors
list_dep = ['75', '92', '94', '91', '93', '78',
             '95', '77']
list_dep_name = ['Paris', 'Hauts-de-Seine', 'Val-de-Marne', 'Essonne','Seine-Saint-Denis',
                 'Yvelines',
                  "Val d'Oise", 'Seine-et-Marne'
                ]

departement_idf_pattern = '|'.join(['^' + d for d in list_dep])

palette_colors = sns.color_palette("Set1").as_hex() + sns.color_palette("Set2").as_hex()

dfcolors_DCLT = pd.DataFrame({'DEP_DCLT': list_dep,
                              'color_DCLT': palette_colors[:len(list_dep)]})

dfcolors_COMMUNE = pd.DataFrame({'DEP_COMMUNE': list_dep,
                                 'color_COMMUNE': palette_colors[:len(list_dep)]})

display(Markdown('<br>'.join(
    f'<span style="font-family: monospace"> <span style="color: {palette_colors[c]}">████████</span> {list_dep_name[c]} </span>'
    for c in range(len(list_dep))
)))
████████ Paris████████ Hauts-de-Seine████████ Val-de-Marne████████ Essonne████████ Seine-Saint-Denis████████ Yvelines████████ Val d’Oise████████ Seine-et-Marne
[8]:
# coordinates of Notre Dame de Paris in epsg:3857
ndm_paris = Point(261502.2414969356, 6250007.719802492)

# compute distance to Paris for all cities
idfgeo = (pd.concat([
    (com
        .query("insee_reg == '11'")
        .query("insee_com != '75056'")
        [['insee_com', 'geometry', 'nom', 'population']]),
    (arr
        .query("insee_com.str.contains('^75')")
        .drop('insee_com', axis=1)
        .rename(columns={'insee_arm': 'insee_com'})
        [['insee_com', 'geometry', 'nom', 'population']])])
    .assign(center = lambda x: x['geometry'].apply(lambda y: y.centroid))
    .assign(distance_paris = lambda x: x['center'].apply(lambda y: ndm_paris.distance(y)))
    .sort_values('distance_paris', ascending=False)
    .reset_index(drop=True)
          )
[9]:
idfgeo_com = idfgeo.drop(columns={'geometry', 'center'})
idfgeo_com.columns = ['COMMUNE', 'COMMUNE_NAME', 'COMMUNE_POP','distance_paris']

idfgeo_dclt = idfgeo_com.copy()
idfgeo_dclt.columns = ['DCLT', 'DCLT_NAME', 'DCLT_POP','distance_paris_DCLT']
[10]:
# distances are measured with epsg 3857
# it may not reflect real distances
# hence, parameters are adjusted so that data captures only up to CDG airport
distance_paris_max = 40 * 1000
[11]:
# data preparation from raw data
# only communes located less than 40km far from Paris are selected from Ile de France region
# only working places in Ile de France are kept

idfData = (RP_MOBPRO_2020
           .query("REGION == '11'")
           .assign(COMMUNE = lambda x: np.where(x['COMMUNE'] == '75056', x['ARM'], x['COMMUNE']))
           .query("DCLT.str.contains(@departement_idf_pattern)")
           .assign(IPONDI = lambda x: x['IPONDI'].astype(float))
           .groupby(['COMMUNE', 'DCLT'], as_index=False)
           .agg(IPONDI = ('IPONDI','sum'))
           .merge(idfgeo_com, on='COMMUNE', how='left')
           .merge(idfgeo_dclt, on='DCLT', how='left')
           .query("distance_paris <= @distance_paris_max")
           .query("distance_paris_DCLT <= @distance_paris_max")
           .assign(COMMUNE_POP = lambda x: pd.to_numeric(x['COMMUNE_POP']))
           .assign(DCLT_POP = lambda x: pd.to_numeric(x['DCLT_POP']))
           .assign(DEP_DCLT = lambda df: df['DCLT'].apply(lambda x: x[:2]))
           .assign(DEP_COMMUNE = lambda df: df['COMMUNE'].apply(lambda x: x[:2]))
           .assign(WORKER_TOT = lambda df: df.groupby('DCLT')['IPONDI'].transform('sum'))
           .sort_values('WORKER_TOT', ascending=False)
           .reset_index(drop=True)
          )

ptot = sum((idfData
            [['COMMUNE', 'COMMUNE_POP']]
            .drop_duplicates()
            ['COMMUNE_POP']))
pondtot = sum(idfData['IPONDI'])

print(f'{ptot=}')
print(f'{pondtot=:.0f}')

display(idfData[idfData['COMMUNE'].str.contains('^75')].head(3))
ptot=9744647
pondtot=4204594
| COMMUNE | DCLT | IPONDI | COMMUNE_NAME | COMMUNE_POP | distance_paris | DCLT_NAME | DCLT_POP | distance_paris_DCLT | DEP_DCLT | DEP_COMMUNE | WORKER_TOT | |
|---|---|---|---|---|---|---|---|---|---|---|---|---|
| 1 | 75101 | 75115 | 198.684933 | Paris 1er Arrondissement | 16030 | 2107.463834 | Paris 15e Arrondissement | 229472 | 6652.86722 | 75 | 75 | 158675.267506 |
| 11 | 75107 | 75115 | 1026.511137 | Paris 7e Arrondissement | 48520 | 4142.781903 | Paris 15e Arrondissement | 229472 | 6652.86722 | 75 | 75 | 158675.267506 |
| 32 | 75119 | 75115 | 2378.153858 | Paris 19e Arrondissement | 183211 | 6957.840029 | Paris 15e Arrondissement | 229472 | 6652.86722 | 75 | 75 | 158675.267506 |
[12]:
# threshold to define small cities in terms of population
ptot_threshold = 20000

# threshold defining flow of workers excluded from the visualisation
ipondi_threshold = 120
[13]:
# if many people work in a city but few people live there
# this city is not considered as 'small'
list_big_working_center = list((idfData
                        .query("WORKER_TOT >= @ptot_threshold")
                        ['DCLT']
                        .unique()
                          ))

smallCom = (idfData
        .merge(idfgeo, right_on='insee_com', left_on='COMMUNE', how='left')
        .query("(COMMUNE_POP <= @ptot_threshold) and (COMMUNE not in @list_big_working_center)")
        .reset_index(drop=True)
 )

ptot3 = sum(smallCom[['COMMUNE', 'COMMUNE_POP']].drop_duplicates()['COMMUNE_POP'])
pondtot3 = sum(smallCom['IPONDI'])

print(f"ptot {ptot3/ptot*100:.0f}%")
print(f"pondtot {pondtot3/pondtot*100:.0f}%")
print(f"pop range: {min(smallCom.COMMUNE_POP)} - {max(smallCom.COMMUNE_POP)}")
print(f"cities : {len(smallCom.COMMUNE.unique())}")
smallCom.head(5)
ptot 13%
pondtot 13%
pop range: 77 - 19943
cities : 171
[13]:
| COMMUNE | DCLT | IPONDI | COMMUNE_NAME | COMMUNE_POP | distance_paris_x | DCLT_NAME | DCLT_POP | distance_paris_DCLT | DEP_DCLT | DEP_COMMUNE | WORKER_TOT | insee_com | geometry | nom | population | center | distance_paris_y | |
|---|---|---|---|---|---|---|---|---|---|---|---|---|---|---|---|---|---|---|
| 0 | 78372 | 75115 | 137.489593 | Marly-le-Roi | 16352 | 28751.099410 | Paris 15e Arrondissement | 229472 | 6652.86722 | 75 | 78 | 158675.267506 | 78372 | MULTIPOLYGON (((231328.42141112 6253478.413274... | Marly-le-Roi | 16352 | POINT (232819.32891271802 6251986.6697672615) | 28751.099410 |
| 1 | 78367 | 75115 | 21.554111 | Mareil-Marly | 3669 | 30679.439033 | Paris 15e Arrondissement | 229472 | 6652.86722 | 75 | 78 | 158675.267506 | 78367 | MULTIPOLYGON (((232007.36266255 6254301.201724... | Mareil-Marly | 3669 | POINT (231170.9966398288 6254616.793980174) | 30679.439033 |
| 2 | 95682 | 75115 | 5.105820 | Villiers-le-Sec | 193 | 37744.524377 | Paris 15e Arrondissement | 229472 | 6652.86722 | 75 | 95 | 158675.267506 | 95682 | MULTIPOLYGON (((266744.03698707 6289583.072410... | Villiers-le-Sec | 193 | POINT (265674.50005788024 6287520.935859931) | 37744.524377 |
| 3 | 95678 | 75115 | 5.053693 | Villiers-Adam | 857 | 38724.378098 | Paris 15e Arrondissement | 229472 | 6652.86722 | 75 | 95 | 158675.267506 | 95678 | MULTIPOLYGON (((253130.560195 6287866.69944999... | Villiers-Adam | 857 | POINT (249213.191462859 6286730.419979663) | 38724.378098 |
| 4 | 78686 | 75115 | 407.381366 | Viroflay | 16744 | 21563.416164 | Paris 15e Arrondissement | 229472 | 6652.86722 | 75 | 78 | 158675.267506 | 78686 | MULTIPOLYGON (((240592.31554645 6243153.844997... | Viroflay | 16744 | POINT (241709.96463572598 6241449.291599193) | 21563.416164 |
[14]:
# regroup small cities if they are next to one another and if they are in the same departement
# the ones left behind are regrouped by departement

list_com_group = {}

list_com = list(smallCom['COMMUNE'].unique())

list_city_grouped = []

for c in list_com:

    if c not in list_city_grouped:

        com = smallCom.query("COMMUNE == @c").reset_index(drop=True)

        dep = com['DEP_COMMUNE'][0]

        geo = com['geometry'][0]

        comDep = (smallCom
                  .query("(DEP_COMMUNE == @dep) and (COMMUNE != @c)")
                  [['COMMUNE', 'geometry', 'COMMUNE_NAME']]
                  .drop_duplicates())

        list_com_group[c] = [i for i, g in zip(list(comDep['COMMUNE']),
                                              list(comDep['geometry']))
                                if (g.intersects(geo)) and (i not in list_city_grouped)]

        list_city_grouped += list_com_group[c] + [c]

list_com_group_alone = [k for k in list_com_group.keys() if len(list_com_group[k]) == 0]

list_com_dep_missing = list(set([k[:2] for k in list_com_group_alone]))

list_com_group_missing = {}

for d in list_com_dep_missing:
    list_com_group_missing[d] = [k for k in list_com_group_alone if d == k[:2]]
    if len(list_com_group_missing[d]) > 1:
        first = list_com_group_missing[d][0]
        list_com_group_missing[first] = list_com_group_missing[d][1:]
        del list_com_group_missing[d]
    else:
        first = list_com_group_missing[d][0]
        list_com_group_missing[first] = []
        del list_com_group_missing[d]

list_com_group_final = {**{k:list_com_group[k]
                               for k in list_com_group.keys() if len(list_com_group[k]) != 0},
                        **list_com_group_missing}

dict_small_cities = {k2: k for k in list_com_group_final.keys() for k2 in list_com_group_final[k]}
dict_small_cities = {**dict_small_cities, **{k: k for k in list_com_group_final.keys()}}
[15]:
smallComRegrouped_list = []
for k in list_com_group_final.keys():
    comGroup = list_com_group_final[k] + [k]
    smallComR = (smallCom
                 .query("COMMUNE in @comGroup")
                 .query("DCLT not in @comGroup")
                 .sort_values('COMMUNE_POP', ascending=False)
                )
    new_name = '\n'.join(list(smallComR['COMMUNE_NAME'].unique()))
    smallComR.loc[:, 'COMMUNE_NAME'] = new_name
    smallComR.loc[:, 'COMMUNE'] = k
    smallComRegrouped_list += [smallComR]

small_cities = pd.concat(smallComRegrouped_list)

ptot_small = (small_cities
              [['COMMUNE', 'COMMUNE_POP']]
             .drop_duplicates()
             .groupby(['COMMUNE'], as_index=False)
             .agg(COMMUNE_POP = ('COMMUNE_POP', 'sum')))

smallComRegrouped = (small_cities
                     .groupby(['COMMUNE', 'DCLT',
                               'COMMUNE_NAME', 'DCLT_NAME',
                               'DEP_COMMUNE', 'DEP_DCLT'], as_index=False)
                     .agg(IPONDI = ('IPONDI', 'sum'))
                     .merge(ptot_small, on='COMMUNE', how='left')
                    )

small_cities_mapping_name = (small_cities[['COMMUNE', 'COMMUNE_NAME']]
                             .drop_duplicates())

small_cities_name = dict(zip(small_cities_mapping_name['COMMUNE'],
                                 small_cities_mapping_name['COMMUNE_NAME']))

small_cities_pop = dict(zip(ptot_small['COMMUNE'],
                                       ptot_small['COMMUNE_POP']))

def replace_small_cities_name(ident, name):
    if ident in small_cities_name.keys():
        new_name = small_cities_name[ident]
    else:
        new_name = name
    return new_name

def replace_small_cities_pop(ident, pop):
    if ident in small_cities_pop.keys():
        new_pop = small_cities_pop[ident]
    else:
        new_pop = pop
    return new_pop
[16]:
bigCities = (idfData
        .query("(COMMUNE_POP > @ptot_threshold) or (COMMUNE in @list_big_working_center)")
             )

ptot2 = sum(bigCities[['COMMUNE', 'COMMUNE_POP']].drop_duplicates()['COMMUNE_POP'])
pondtot2 = sum(bigCities['IPONDI'])

print(f"ptot {ptot2/ptot*100:.0f}%")
print(f"pondtot {pondtot2/pondtot*100:.0f}%")
ptot 87%
pondtot 87%
[17]:
list_col_group = ['COMMUNE', 'DCLT',
                'COMMUNE_NAME', 'DCLT_NAME',
                'DEP_COMMUNE', 'DEP_DCLT',
                'COMMUNE_POP']

idfData2 = (pd.concat([bigCities, smallComRegrouped])
        .query("DCLT != COMMUNE")
        .assign(DCLT = lambda x: x['DCLT'].apply(
                lambda y: dict_small_cities[y] if y in dict_small_cities.keys() else y
            ))
        .assign(DCLT_NAME = lambda x:
                x[['DCLT', 'DCLT_NAME']].apply(
                    lambda y: replace_small_cities_name(*y), axis=1
            ))
        .apply(lambda c: c.astype(str) if c.name in list_col_group else c)
        .groupby(list_col_group, as_index=False)
        .agg(IPONDI = ('IPONDI', 'sum'))
        .assign(COMMUNE_POP = lambda x: pd.to_numeric(x['COMMUNE_POP']))
        .reset_index(drop=True)
        .merge(dfcolors_DCLT, on = 'DEP_DCLT', how='left')
        .merge(dfcolors_COMMUNE, on = 'DEP_COMMUNE', how='left')
        .sort_values(['COMMUNE_POP'], ascending=False)
        .merge(idfgeo_dclt[['DCLT', 'DCLT_POP']], on='DCLT', how='left')
        .assign(DCLT_POP = lambda x:
                x[['DCLT', 'DCLT_POP']].apply(
                    lambda y: replace_small_cities_pop(*y), axis=1
            ))
           )

print(' ')
ptot2 = sum(idfData2[['COMMUNE', 'COMMUNE_POP']].drop_duplicates()['COMMUNE_POP'])
pondtot2 = sum(idfData2['IPONDI'])

print(f"ptot {ptot2/ptot*100:.0f}%")
print(f"pondtot {pondtot2/pondtot*100:.0f}%")
print(f"pop range: {min(idfData2.COMMUNE_POP)} - {max(idfData2.COMMUNE_POP)}")
print(f"cities : {len(idfData2.COMMUNE.unique())}")

display(idfData2.head(5))
ptot 100%
pondtot 75%
pop range: 385 - 229472
cities : 227
| COMMUNE | DCLT | COMMUNE_NAME | DCLT_NAME | DEP_COMMUNE | DEP_DCLT | COMMUNE_POP | IPONDI | color_DCLT | color_COMMUNE | DCLT_POP | |
|---|---|---|---|---|---|---|---|---|---|---|---|
| 0 | 75115 | 95582 | Paris 15e Arrondissement | Sannois | 75 | 95 | 229472 | 10.680057 | #a65628 | #e41a1c | 26524 |
| 1 | 75115 | 91339 | Paris 15e Arrondissement | Montlhéry\nLinas | 75 | 91 | 229472 | 28.824383 | #984ea3 | #e41a1c | 15425 |
| 2 | 75115 | 91345 | Paris 15e Arrondissement | Longjumeau | 75 | 91 | 229472 | 24.813545 | #984ea3 | #e41a1c | 21105 |
| 3 | 75115 | 78686 | Paris 15e Arrondissement | Viroflay\nAigremont | 75 | 78 | 229472 | 39.697347 | #ffff33 | #e41a1c | 17829 |
| 4 | 75115 | 91064 | Paris 15e Arrondissement | Verrières-le-Buisson\nIgny\nBièvres\nSaclay\nV... | 75 | 91 | 229472 | 169.085663 | #984ea3 | #e41a1c | 35870 |
[18]:
# compute statistics on where workers work in percentage by city

working_place_ranking = (
     idfData2
     .groupby(['DCLT', 'DCLT_NAME', 'DEP_DCLT'], as_index=False)
     .agg(IPONDI = ('IPONDI', 'sum'), DCLT_POP = ('DCLT_POP', 'min'))
     .assign(pct_worker0 = lambda x: x['IPONDI'] * 100 / sum(x['IPONDI']))
     .assign(pct_worker = lambda x: x['pct_worker0'].apply(lambda y: str(round(y, 2)) + '%'))
     .assign(pct_pop0 = lambda x: x['DCLT_POP'] * 100 / sum(x['DCLT_POP']))
     .assign(pct_pop = lambda x: x['pct_pop0'].apply(lambda y: str(round(y, 2)) + '%'))
     .sort_values('pct_worker', ascending=False)
     .reset_index(drop=True)
     .assign(working_place_ranking = lambda x: x.index + 1)
     .rename(columns = {'DCLT' : 'COMMUNE'})
     .drop(columns = {'IPONDI'})
)
working_place_ranking.head(10)
[18]:
| COMMUNE | DCLT_NAME | DEP_DCLT | DCLT_POP | pct_worker0 | pct_worker | pct_pop0 | pct_pop | working_place_ranking | |
|---|---|---|---|---|---|---|---|---|---|
| 0 | 75108 | Paris 8e Arrondissement | 75 | 35631 | 4.732278 | 4.73% | 0.365647 | 0.37% | 1 |
| 1 | 75115 | Paris 15e Arrondissement | 75 | 229472 | 3.851695 | 3.85% | 2.354852 | 2.35% | 2 |
| 2 | 75109 | Paris 9e Arrondissement | 75 | 60168 | 2.954503 | 2.95% | 0.617447 | 0.62% | 3 |
| 3 | 75113 | Paris 13e Arrondissement | 75 | 177833 | 2.663345 | 2.66% | 1.824930 | 1.82% | 4 |
| 4 | 75112 | Paris 12e Arrondissement | 75 | 140311 | 2.589525 | 2.59% | 1.439878 | 1.44% | 5 |
| 5 | 92026 | Courbevoie | 92 | 82074 | 2.401820 | 2.4% | 0.842247 | 0.84% | 6 |
| 6 | 75116 | Paris 16e Arrondissement | 75 | 162820 | 2.396540 | 2.4% | 1.670866 | 1.67% | 7 |
| 7 | 75117 | Paris 17e Arrondissement | 75 | 166336 | 2.219577 | 2.22% | 1.706947 | 1.71% | 8 |
| 8 | 92062 | Puteaux | 92 | 44009 | 2.003127 | 2.0% | 0.451622 | 0.45% | 9 |
| 9 | 92012 | Boulogne-Billancourt | 92 | 120911 | 1.967958 | 1.97% | 1.240794 | 1.24% | 10 |
[19]:
# compute statistics on where workers work in percentage by departement

list_dep_ordered = ['75', '92', '94', '93', '91', '95', '77']

working_dep_ranking = (
    idfData2
    .groupby(['DEP_COMMUNE', 'DEP_DCLT'], as_index=False)
    .agg(IPONDI = ('IPONDI', 'sum'))
    .assign(POND_COM = lambda x: x.groupby(['DEP_COMMUNE'])['IPONDI'].transform('sum'))
    .assign(pct = lambda x: round(100 * x['IPONDI'] / x['POND_COM'], 1))
    .pivot(index=['DEP_DCLT'], columns=['DEP_COMMUNE'], values = 'pct')
    .reindex(list_dep_ordered)
    [list_dep_ordered]
)

import plotly.express as px

fig = (px.imshow(working_dep_ranking,
                text_auto=True)
      )
fig.layout.coloraxis.showscale = False

fig
[20]:
import plotly.express as px
fig = px.scatter(working_place_ranking,
                 x="pct_pop0", y="pct_worker0", color="DEP_DCLT",
                 log_y=True,
                 hover_data=['DCLT_NAME'])
fig
[21]:
# create nodes dataframe for the network visualisation
# we remove small workers flow to make the plot clearer
idfData3 = idfData2.query("IPONDI > @ipondi_threshold")
list_com = list(idfData3['COMMUNE'].unique()) + list(idfData3['DCLT'].unique())
all_cities = pd.concat([idfData3
[['COMMUNE', 'COMMUNE_NAME', 'color_COMMUNE', 'COMMUNE_POP']],
(idfData3
[['DCLT', 'DCLT_NAME', 'color_DCLT', 'DCLT_POP']]
.rename(columns= {'DCLT': 'COMMUNE',
'DCLT_NAME': 'COMMUNE_NAME',
'DCLT_POP': 'COMMUNE_POP',
'color_DCLT': 'color_COMMUNE'}))
])
list_nodes = (all_cities
.query("COMMUNE in @list_com")
.apply(lambda c: c.astype(str) if c.name != 'COMMUNE_POP' else c.astype(float))
.drop_duplicates()
.merge(working_place_ranking, on ='COMMUNE', how='left')
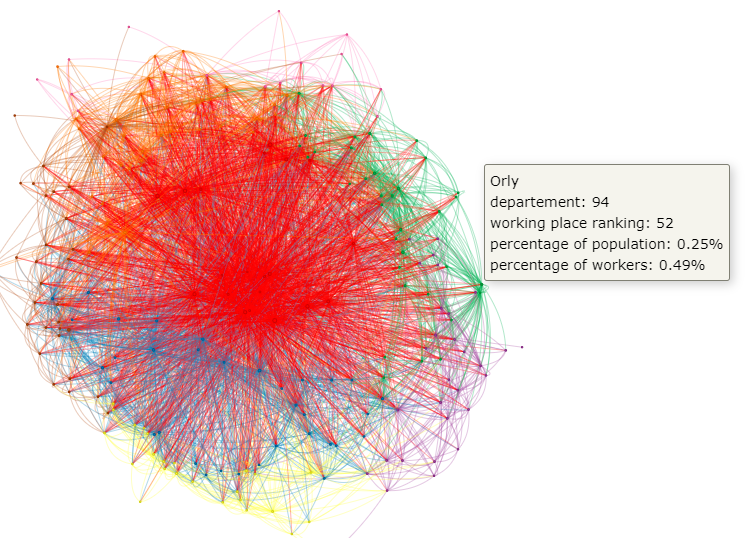
.assign(COMMUNE_NAME = lambda x: x.apply(
lambda y: y['COMMUNE_NAME'] + '\n' +
'departement: '+ str(y['DEP_DCLT']) + '\n' +
'working place ranking: '+ str(y['working_place_ranking']) + '\n' +
'percentage of population: '+ str(y['pct_pop']) + '\n' +
'percentage of workers: '+ str(y['pct_worker']), axis=1))
)
list_nodes.to_csv('network_nodes.csv')
idfData3.to_csv('network_edges.csv')
[28]:
# create network visualization

net = Network(
    notebook=True,
)
net.width = '1900px'
net.height = '1068.75px'
#net.width = '800px'
#net.height = '500px'

for ident, name, color, ptot in zip(list(list_nodes['COMMUNE']),
                       list(list_nodes['COMMUNE_NAME']),
                       list(list_nodes['color_COMMUNE']),
                       list(list_nodes['COMMUNE_POP'])):
    net.add_node(ident, label = name, color=color, value=ptot, title=name)

for ident1, ident2, size, color in zip(list(idfData3['COMMUNE']),
                                list(idfData3['DCLT']),
                                list(idfData3['IPONDI']),
                                list(idfData3['color_DCLT'])
                               ):
    net.add_edge(ident1, ident2, value=size, color=color)

net.force_atlas_2based()

filename = 'commute_paris_network.html'
net.save_graph(filename)
#net.show(filename)
Warning: When cdn_resources is 'local' jupyter notebook has issues displaying graphics on chrome/safari. Use cdn_resources='in_line' or cdn_resources='remote' if you have issues viewing graphics in a notebook.
[34]:
import os
from PIL import Image

picture_link = '/home/onyxia/work/pynsee/docs/_static'

if os.path.exists(picture_link):
    os.chdir(picture_link)

    Image.open('commute_paris.png').convert("RGB")
[34]: