Presidential Election 2022
[1]:
from pynsee import get_geodata, get_geodata_list
import requests
import tempfile
import pandas as pd
/usr/local/lib/python3.12/site-packages/tqdm/auto.py:21: TqdmWarning: IProgress not found. Please update jupyter and ipywidgets. See https://ipywidgets.readthedocs.io/en/stable/user_install.html
  from .autonotebook import tqdm as notebook_tqdm
[2]:
import matplotlib.cm as cm
from matplotlib.colors import ListedColormap
import matplotlib.pyplot as plt
import seaborn as sns
[3]:
import logging
import sys
logging.basicConfig(stream=sys.stdout,
                    level=logging.INFO,
                    format="%(message)s")
[4]:
# download data from data.gouv.fr
url = 'https://www.data.gouv.fr/fr/datasets/r/1ffb6125-1cea-4a03-80be-520c1c3a5411'

def download_data(url=url):

    results = requests.get(url)
    dirpath = tempfile.mkdtemp()
    dwnFile = dirpath + '\\fr_presidential_election_1stround_2022.txt'

    with open(dwnFile, 'wb') as f:
        f.write(results.content)
        f.close()

    return dwnFile

dwnFile = download_data()
[5]:
def make_dataframes(dataFile=dwnFile):
    """
    function to make clean dataframes from data.gouv.fr file
        it returns one dataframe containing data about votes by candidate and commune,
        and a dataframe containing communes agregated data
    """

    # import data
    data = pd.read_csv(dataFile, dtype='str', sep=';', encoding='latin-1', skiprows=1, header=None)
    colNames = pd.read_csv(dataFile, dtype='str', sep=';', encoding='latin-1', nrows=1, header=None)
    colNamesCommunes = colNames.iloc[0,:18].to_list()
    colNamesBallots = colNames.iloc[0,19:len(colNames.columns)].to_list()

    # make dataframe only on communes agregated data
    dfCommunes = data.iloc[:,:18]
    dfCommunes.columns = colNamesCommunes

    # make dataframe only with detailed data, candidate by candidate
    icols = [x for x in range(4)] + [x for x in range(19, len(data.columns))]
    dfBallots = data.iloc[:, icols]
    dfBallots.columns = [x for x in range(len(dfBallots.columns))]
    colnamesCandidates = colNamesCommunes[:4] + colNamesBallots

    # reshape detailed data
    list_df = []
    for icandidate in range(1, 12):
        icols = [x for x in range(4)] + [x for x in range(7 * (icandidate - 1) + 4, 7 * icandidate + 4)]
        dfBallotsCandidate = dfBallots.iloc[:, icols]
        dfBallotsCandidate.columns = colnamesCandidates
        list_df += [dfBallotsCandidate]

    dfFinal = pd.concat(list_df).reset_index(drop=True)

    dfFinal['Voix'] = pd.to_numeric(dfFinal['Voix'])

    dfFinal = dfFinal.rename(columns={"Code du département":"dep", "Code de la commune":"com"})
    dfCommunes = dfCommunes.rename(columns={"Code du département":"dep", "Code de la commune":"com"})

    # add clean communes id
    for r in dfCommunes.index:
        dep = str(dfCommunes.loc[r, "dep"])
        comId = str(dfCommunes.loc[r, "com"])
        if dep.startswith('Z'):
            dep = '97'
        dfCommunes.loc[r,"insee_com"] = dep + comId

    dfFinal = dfFinal.merge(dfCommunes, on = ["dep", "com"], how="left")

    return dfFinal, dfCommunes

dfBallots, dfCommunes = make_dataframes()
[6]:
# select only the candidate who has won the most votes for each commune
colList = dfBallots.columns[:4].to_list() + ["insee_com"]
FirstCandidate = dfBallots.loc[dfBallots.reset_index().groupby(colList)['Voix'].idxmax()].reset_index(drop=True)
[7]:
FirstCandidate[:2]
[7]:
| dep | Libellé du département_x | com | Libellé de la commune_x | N°Panneau | Sexe | Nom | Prénom | Voix | % Voix/Ins | ... | % Vot/Ins | Blancs | % Blancs/Ins | % Blancs/Vot | Nuls | % Nuls/Ins | % Nuls/Vot | Exprimés | % Exp/Ins | insee_com | |
|---|---|---|---|---|---|---|---|---|---|---|---|---|---|---|---|---|---|---|---|---|---|
| 0 | 01 | Ain | 001 | L'Abergement-Clémenciat | 3 | M | MACRON | Emmanuel | 150 | 23,26 | ... | 83,26 | 16 | 2,48 | 2,98 | 1 | 0,16 | 0,19 | 520 | 80,62 | 01001 |
| 1 | 01 | Ain | 002 | L'Abergement-de-Varey | 3 | M | MACRON | Emmanuel | 50 | 23,47 | ... | 82,16 | 3 | 1,41 | 1,71 | 1 | 0,47 | 0,57 | 171 | 80,28 | 01002 |
2 rows × 28 columns
[8]:
# download geographical limits of communes from IGN, and merge it with
IGNCom = get_geodata('ADMINEXPRESS-COG-CARTO.LATEST:commune').transform_overseas().zoom()
IGNCom.loc[lambda x: x['code_insee'].str.contains('^75')]
Previously saved data has been used:
/home/onyxia/.cache/pynsee/pynsee/6cb5dc200198fcdb00222fe8b8f7945b.parquet
Creation date: 2025-06-28, today
Set update=True to get the most up-to-date data
Previously saved data has been used:
/home/onyxia/.cache/pynsee/pynsee/f2bbdea5546ef02791b1286f1b6b1a51.parquet
Creation date: 2025-06-28, today
Set update=True to get the most up-to-date data
[8]:
| geometry | cleabs | nom_officiel | nom_officiel_en_majuscules | statut | code_insee | population | date_du_recensement | organisme_recenseur | code_insee_du_canton | code_insee_de_l_arrondissement | code_insee_du_departement | code_insee_de_la_region | code_siren | codes_siren_des_epci | code_postal | superficie_cadastrale | |
|---|---|---|---|---|---|---|---|---|---|---|---|---|---|---|---|---|---|
| 19308 | MULTIPOLYGON (((259950.061 6258104.764, 260905... | COMMUNE_0000000000075056 | Paris | PARIS | Capitale d'Etat | 75056 | 2113705 | 2022-01-01Z | INSEE | NR | 751 | 75 | 11 | 217500016 | 200054781 | None | 10540 |
| 34877 | MULTIPOLYGON (((-366033.08 6599847.402, -36412... | COMMUNE_0000000000075056 | Paris | PARIS | Capitale d'Etat | 75056 | 2113705 | 2022-01-01Z | INSEE | NR | 751 | 75 | 11 | 217500016 | 200054781 | None | 10540 |
[9]:
FirstCandidate = FirstCandidate.rename(columns = {'insee_com': 'code_insee'})[['code_insee', 'Nom']]
com = IGNCom.merge(FirstCandidate, how='left', on ='code_insee')
[10]:
# make color palette
set1 = sns.color_palette("Set1")
colors = [sns.color_palette("Paired")[4]] + [set1[2], set1[1]] + set1[3:5] + [set1[0]] + set1[6:len(set1)]
cmap = ListedColormap(colors)
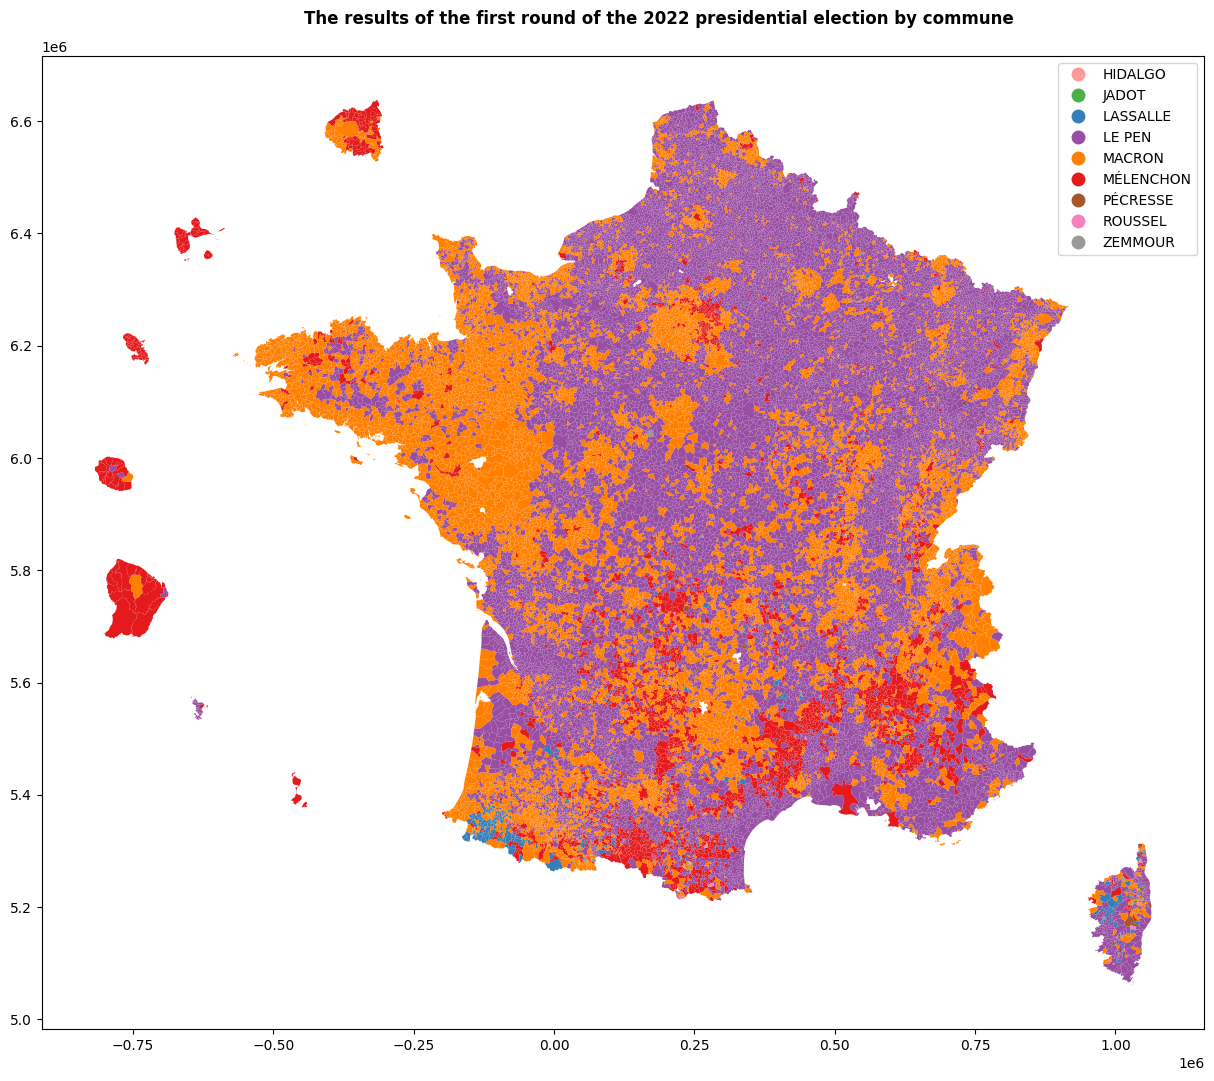
[11]:
fig, ax = plt.subplots(1,1,figsize=[15,15])
com.plot(column='Nom', legend=True, ax=ax, cmap=cmap)
plt.suptitle('The results of the first round of the 2022 presidential election by commune', x = 0.3, y = 0.85,
            horizontalalignment= 'left',
            fontsize = 12, fontweight='bold')
plt.show()