# Subscribe to api.insee.fr and get your credentials!
# Save your credentials with init_conn function :
# from pynsee.utils import init_conn
# init_conn(insee_key="my_insee_key", insee_secret="my_insee_secret")
# Beware : any change to the keys should be tested after having cleared the cache
# Please do : from pynsee.utils import clear_all_cache; clear_all_cache()"
from pynsee.localdata import get_local_metadata, get_local_data
import pandas as pd
pd.options.mode.chained_assignment = None
%matplotlib inline
import matplotlib.pyplot as plt
import logging
import sys
logging.basicConfig(stream=sys.stdout,
level=logging.INFO,
format="%(message)s")
metadata = get_local_metadata()
data = get_local_data(dataset_version='GEO2020RP2017',
variables = 'SEXE-AGED100',
nivgeo = 'FE',
geocodes=['1'])
dataM = data[(data.SEXE == '1') & (data.AGED100 != 'ENS')]
dataF = data[(data.SEXE == '2') & (data.AGED100 != 'ENS')]
dataF['OBS_VALUE'] = dataF['OBS_VALUE'].apply(lambda x: x * -1)
# define plot
y = range(0, len(dataM))
x_male = dataM['OBS_VALUE']
x_female = dataM['OBS_VALUE']
#define plot parameters
fig, axes = plt.subplots(ncols=2, sharey=True, figsize=(12, 5))
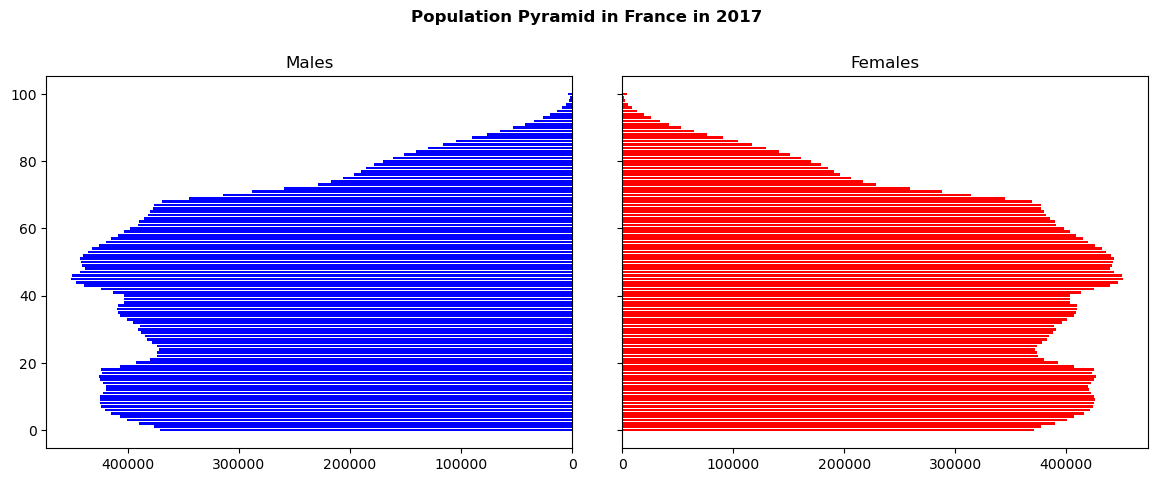
fig.suptitle("Population Pyramid in France in 2017", fontweight='bold')
fig.tight_layout(pad = 2)
#define male and female bars
axes[0].barh(y, x_male, align='center', color='blue')
axes[0].set(title='Males')
axes[1].barh(y, x_female, align='center', color='red')
axes[1].set(title='Females')
axes[0].invert_xaxis()